Building StackUnderflow: Local-First Observability for Coding Agents
A local-first toolkit that ingests session logs from 17 coding-agent providers to surface cost analytics, filesystem time-travel, and a session memory that agents can query mid-task. It answers two questions about your coding agents: what did this run actually cost, and what did I already learn here?
On this page
StackUnderflow v0.9 is out. Local-first observability for AI coding agents. It indexes the session logs your tools already write and turns them into cost analytics, filesystem playback, and a session memory your agents can query mid-task. MIT-licensed, runs entirely on your machine, no telemetry.
pip install stackunderflow   # Python 3.11+
stackunderflow init          # opens the dashboard at localhost:8081
# or: nix run github:0bserver07/StackUnderflow- Repo: github.com/0bserver07/StackUnderflow
- Docs: 0bserver07.github.io/StackUnderflow
- 17 providers: Claude Code, OpenAI Codex, Cursor, and Cline on by default; Gemini, Copilot, Continue, Codeium, Qwen, Roo Code, KiloCode, OpenCode, Cursor Agent, Droid, Kiro, OpenClaw, and Pi behind beta flags
I keep building infrastructure for my own work. building-bourbaki was a math agent. building-chimera decomposed coding agents into primitives. Novalis, a terminal, is releasing soon. StackUnderflow is the one that watches all of them run.
When I wrote up the Schmidhuber build, the cost number took real work to get. The harness showed 750k, which turned out to be the orchestrator’s context-window meter, not the bill. The actual figure, $3,879 across 74 sessions, only came out after walking every JSONL file the build touched and summing the token pools by hand. That manual walk is the thing StackUnderflow automates. It watches the session logs your coding agents already write, and turns them into numbers you can read.
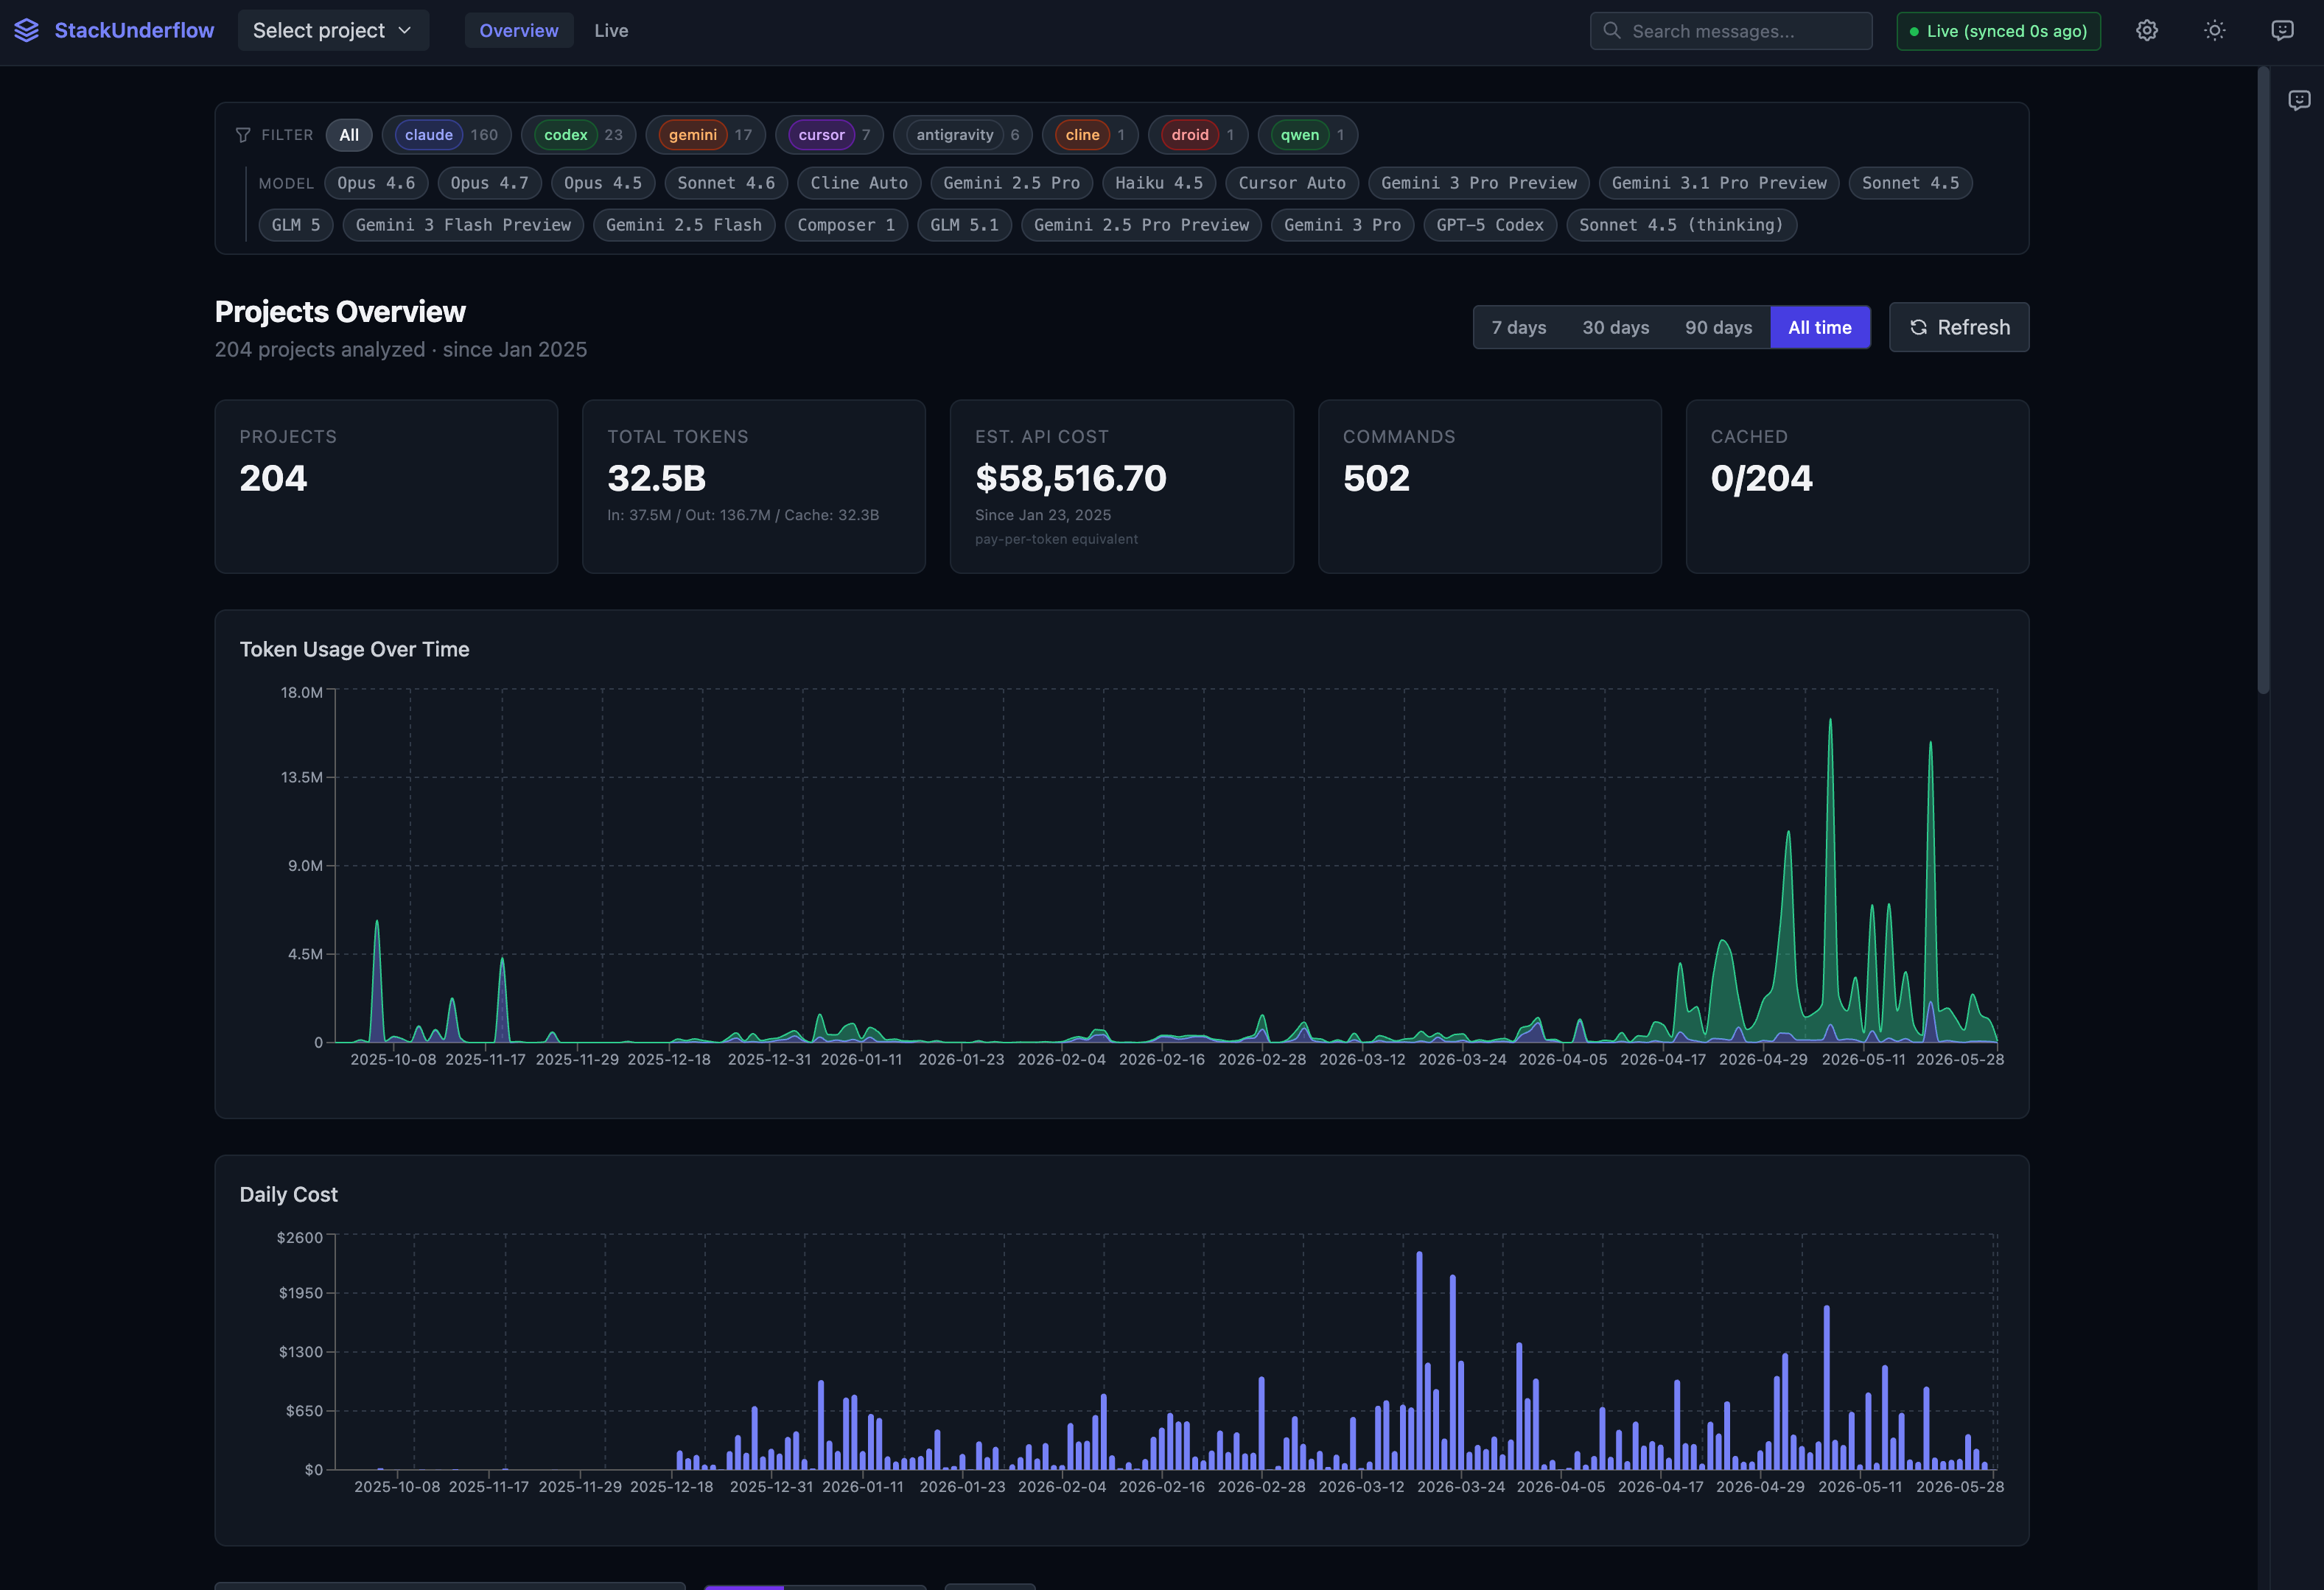
The overview is every project the store has seen: 204 of them since I started logging in early 2025, 32.5B tokens, $58,516.70 at pay-per-token rates. The chips across the top filter by which agent produced the work, from Claude Code down to a single Qwen project. Click a project and every tab below scopes to it.
What it watches
Coding agents leave a trail. Claude Code writes JSONL under ~/.claude/projects/. Codex writes rollouts under ~/.codex/sessions/. Cursor keeps a SQLite blob in its app-support directory; Cline stores task JSON in VS Code’s global storage. Every tool logs what it did, down to the prompts, token counts, tool calls, and file edits, and that trail mostly goes unread.
StackUnderflow has adapters for 17 of these providers. Four are on by default (Claude Code, Codex, Cursor, Cline); the rest opt in with an env var like STACKUNDERFLOW_BETA_GEMINI=1. Each adapter knows where its provider writes logs and how to parse the format, and they all implement the same SourceAdapter protocol: enumerate the sessions, read the records, list the paths to watch.
A watchfiles daemon watches those paths. On any write it ingests the new bytes, normalizes them into a shared schema, recomputes the affected reporting tables, and the dashboard reflects it. Source-file write to fresh dashboard data runs about 400ms, debounced at 200ms so a burst of edits collapses into one refresh.
What it does with the trail
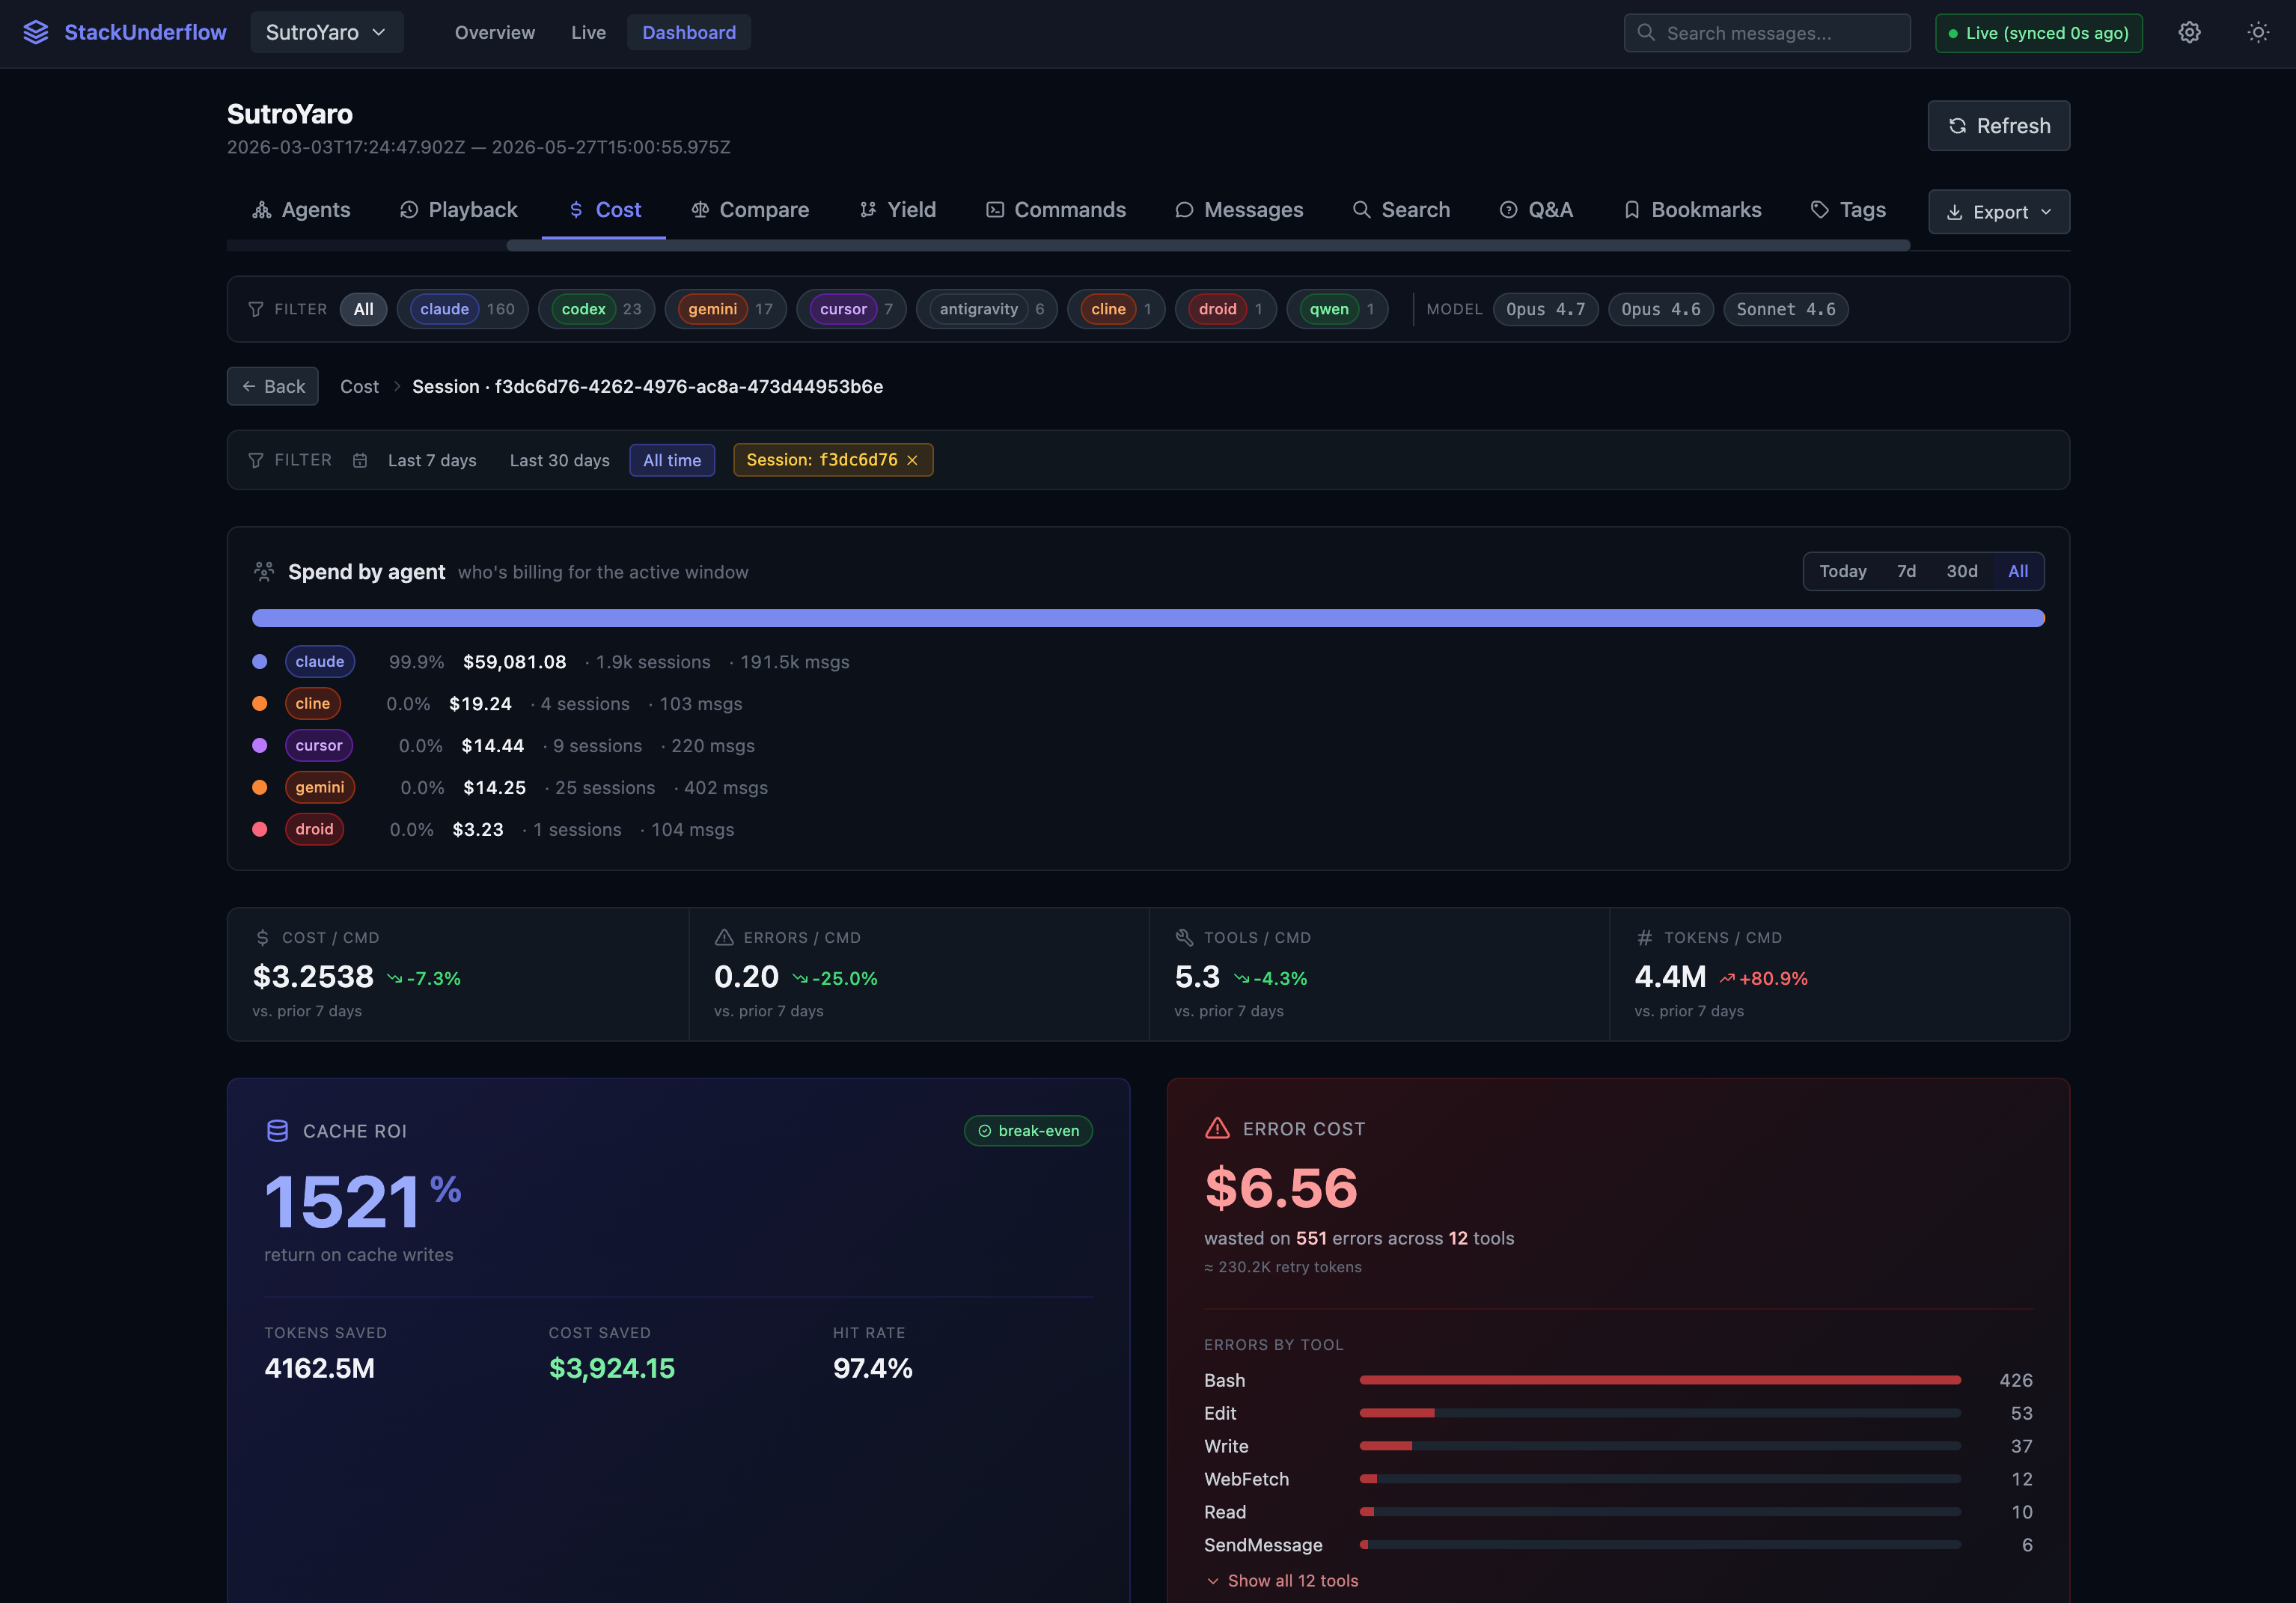
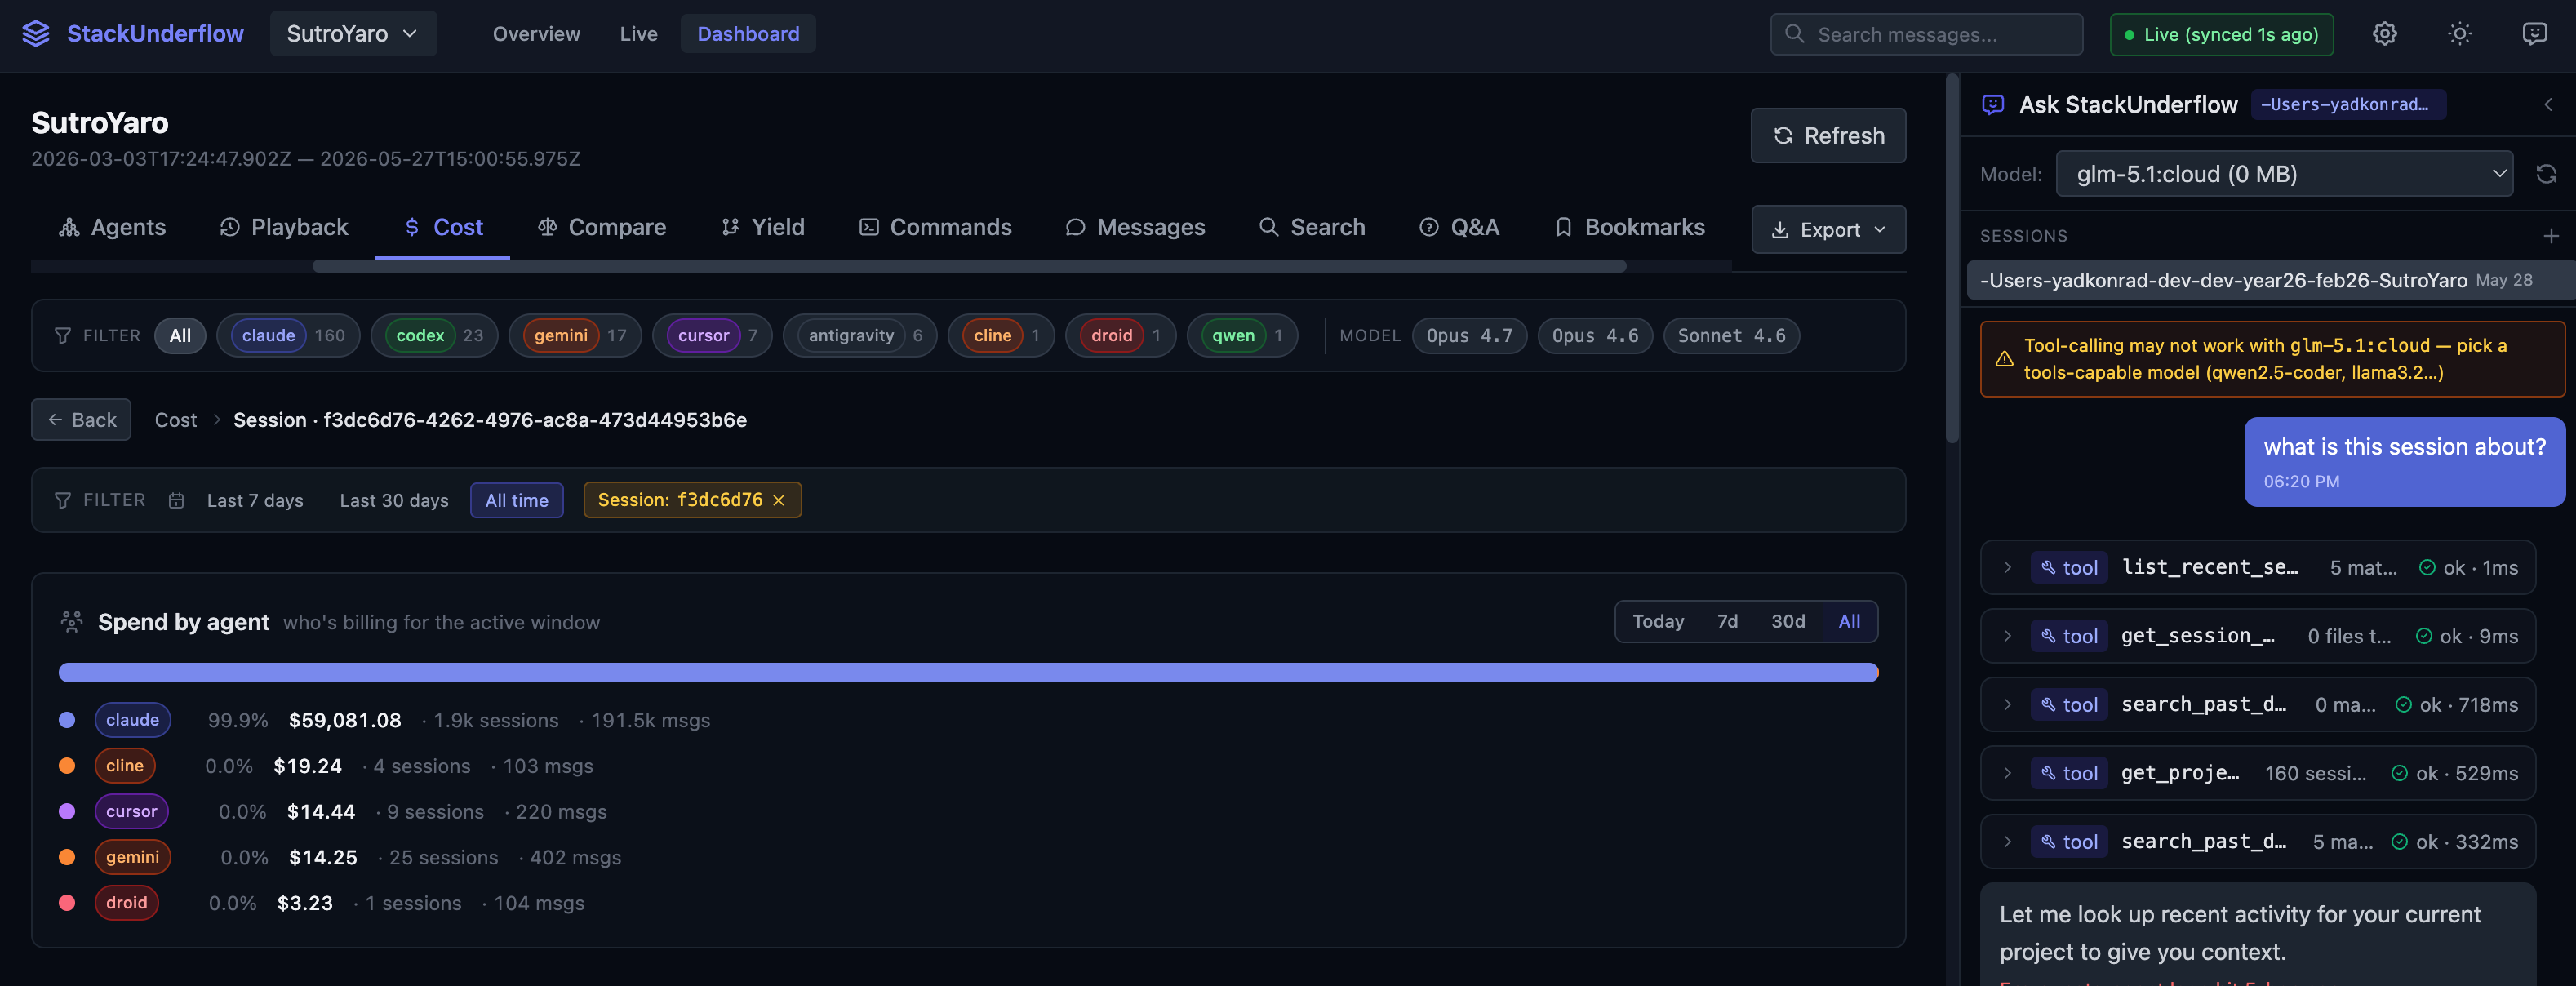
Cost analytics. Every message is priced offline against a per-model rate card, no API call to ask what a token costs. The cost tab ranks sessions and commands by spend and breaks the bill down by agent, and it surfaces the numbers you don’t usually see. On the SutroYaro repo behind the Hinton and Schmidhuber catalogs, cache reuse is running a 1521% ROI ($3,924 saved at a 97.4% hit rate), while $6.56 went to waste on 551 failed tool calls, 426 of them Bash.
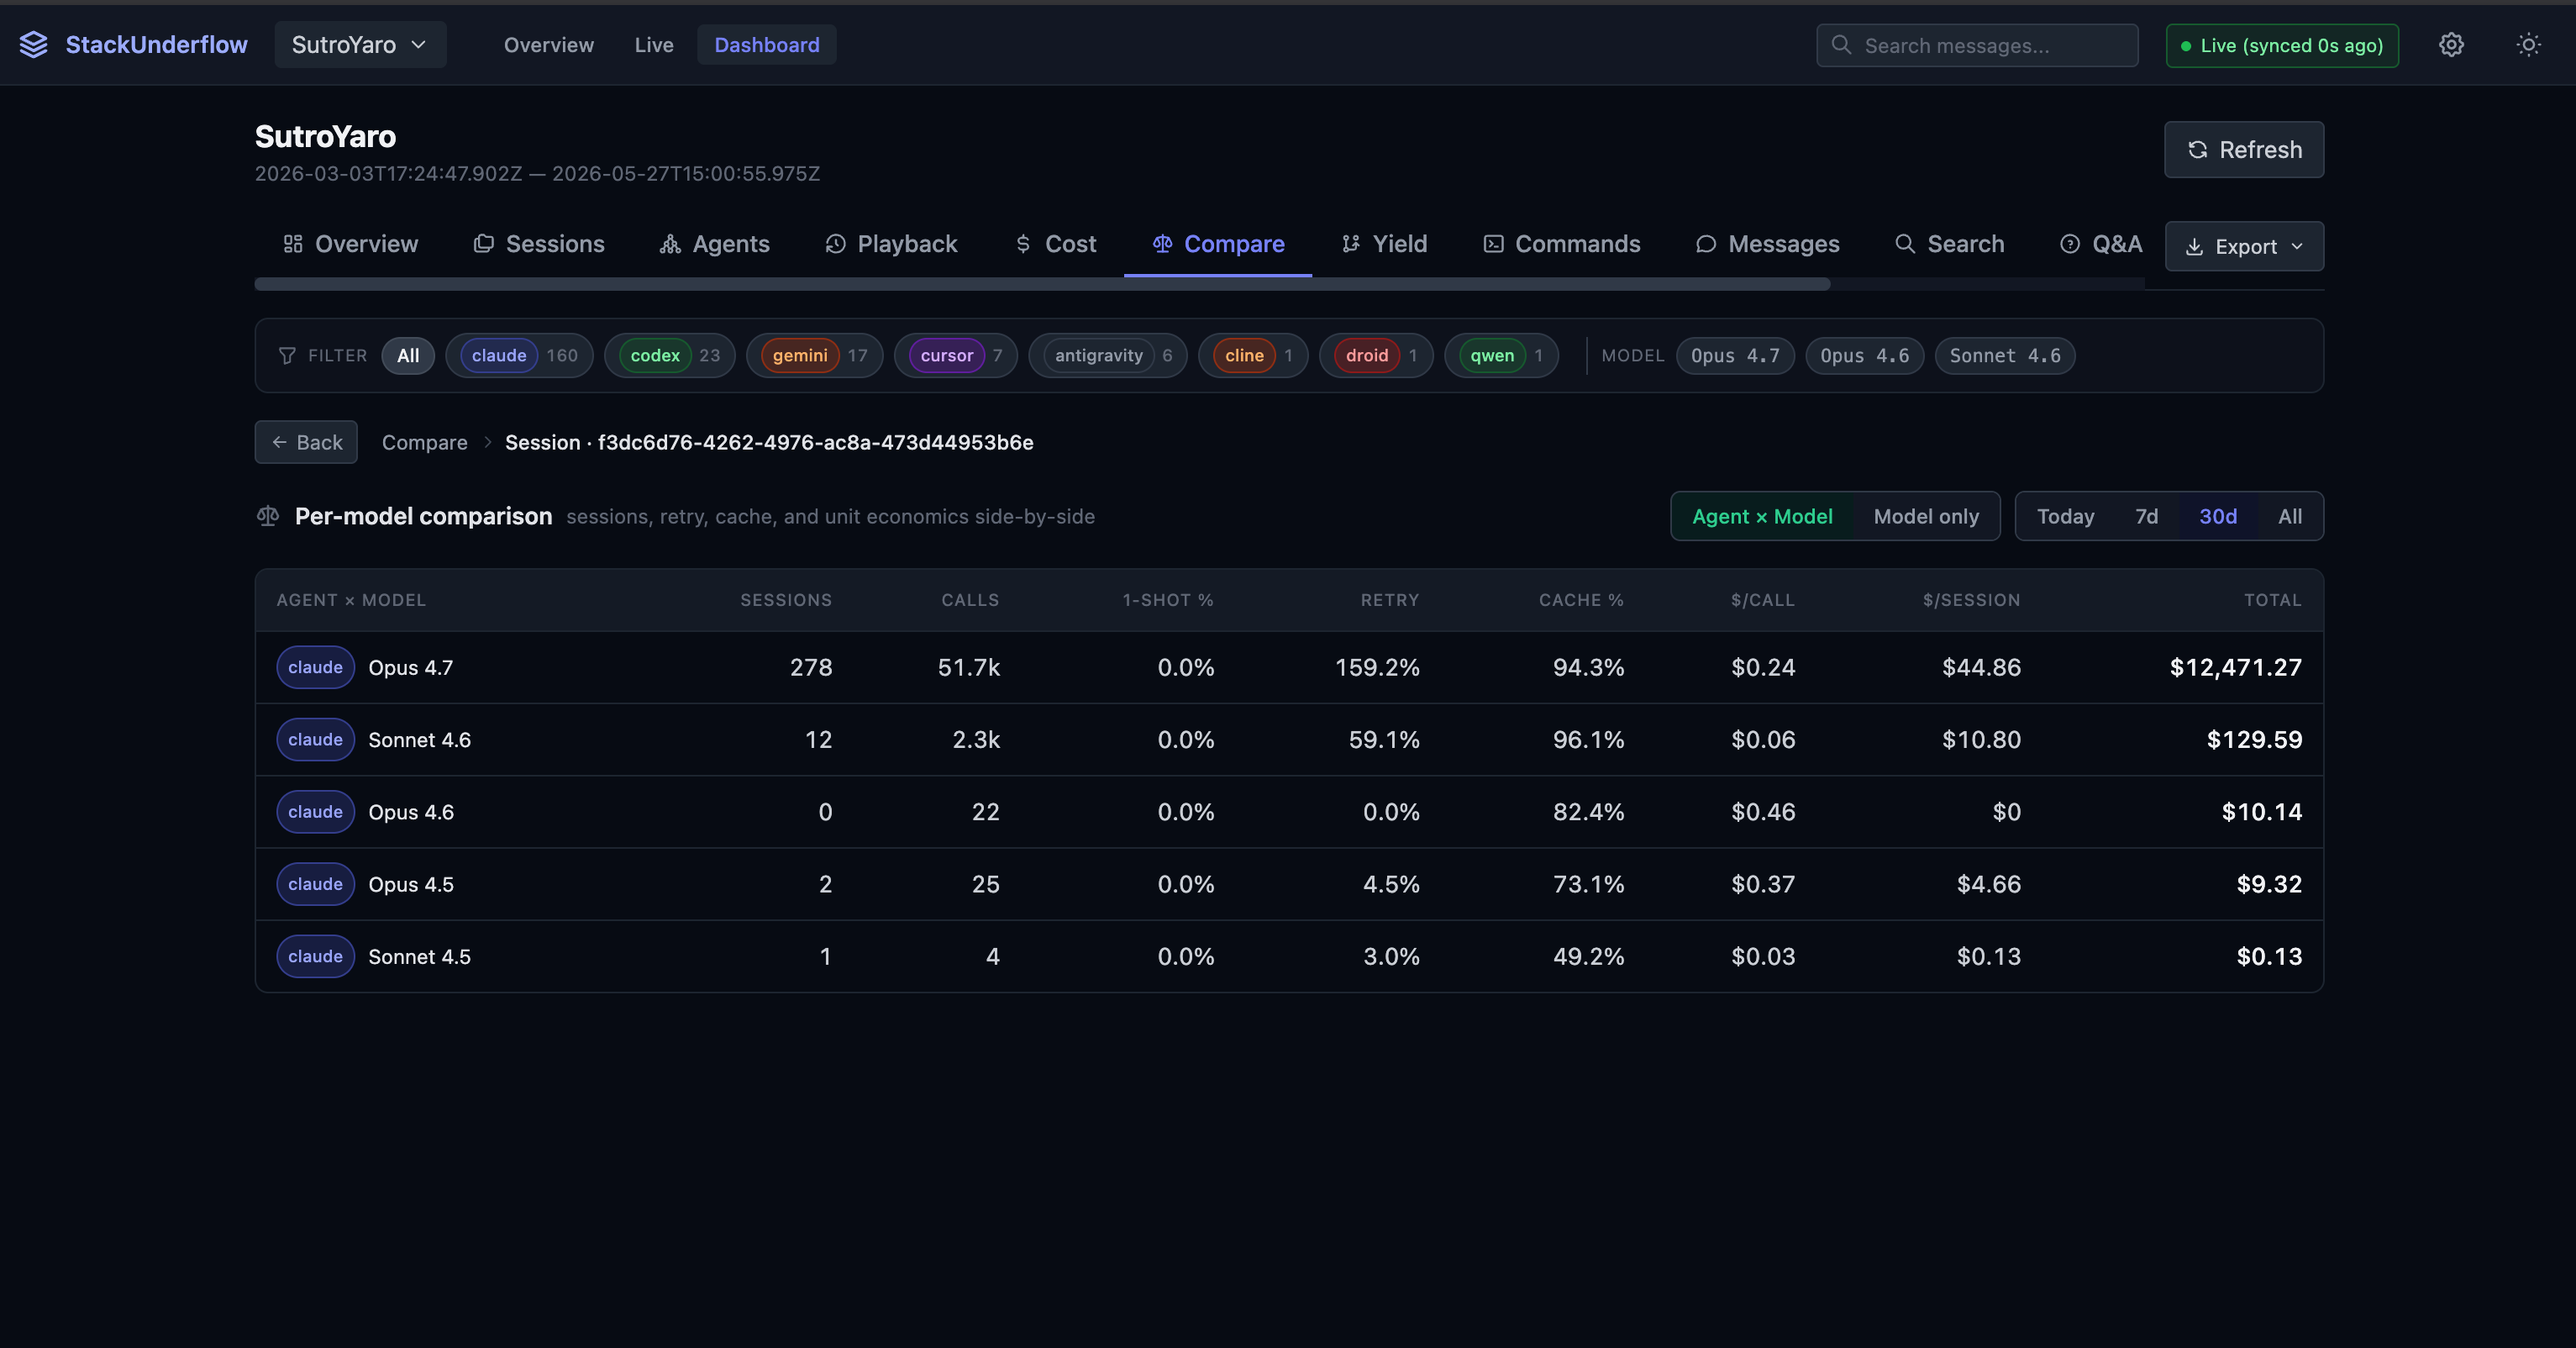
A compare view puts models side by side. Same repo, last 30 days: Opus 4.7 ran 278 sessions at $44.86 each with a 94.3% cache hit rate, next to a handful of Sonnet 4.6 and Opus 4.5 runs. It carries one-shot rate, retry rate, $/call and $/session, grouped by agent-and-model or by model alone.
Yield attribution. Cost alone doesn’t tell you whether a session was worth it. StackUnderflow correlates each session with git log in its working directory and classifies the run: productive if a commit followed within 24 hours, reverted, abandoned, or no-repo. It’s the difference between “this session cost $40” and “this session cost $40 and shipped nothing.”
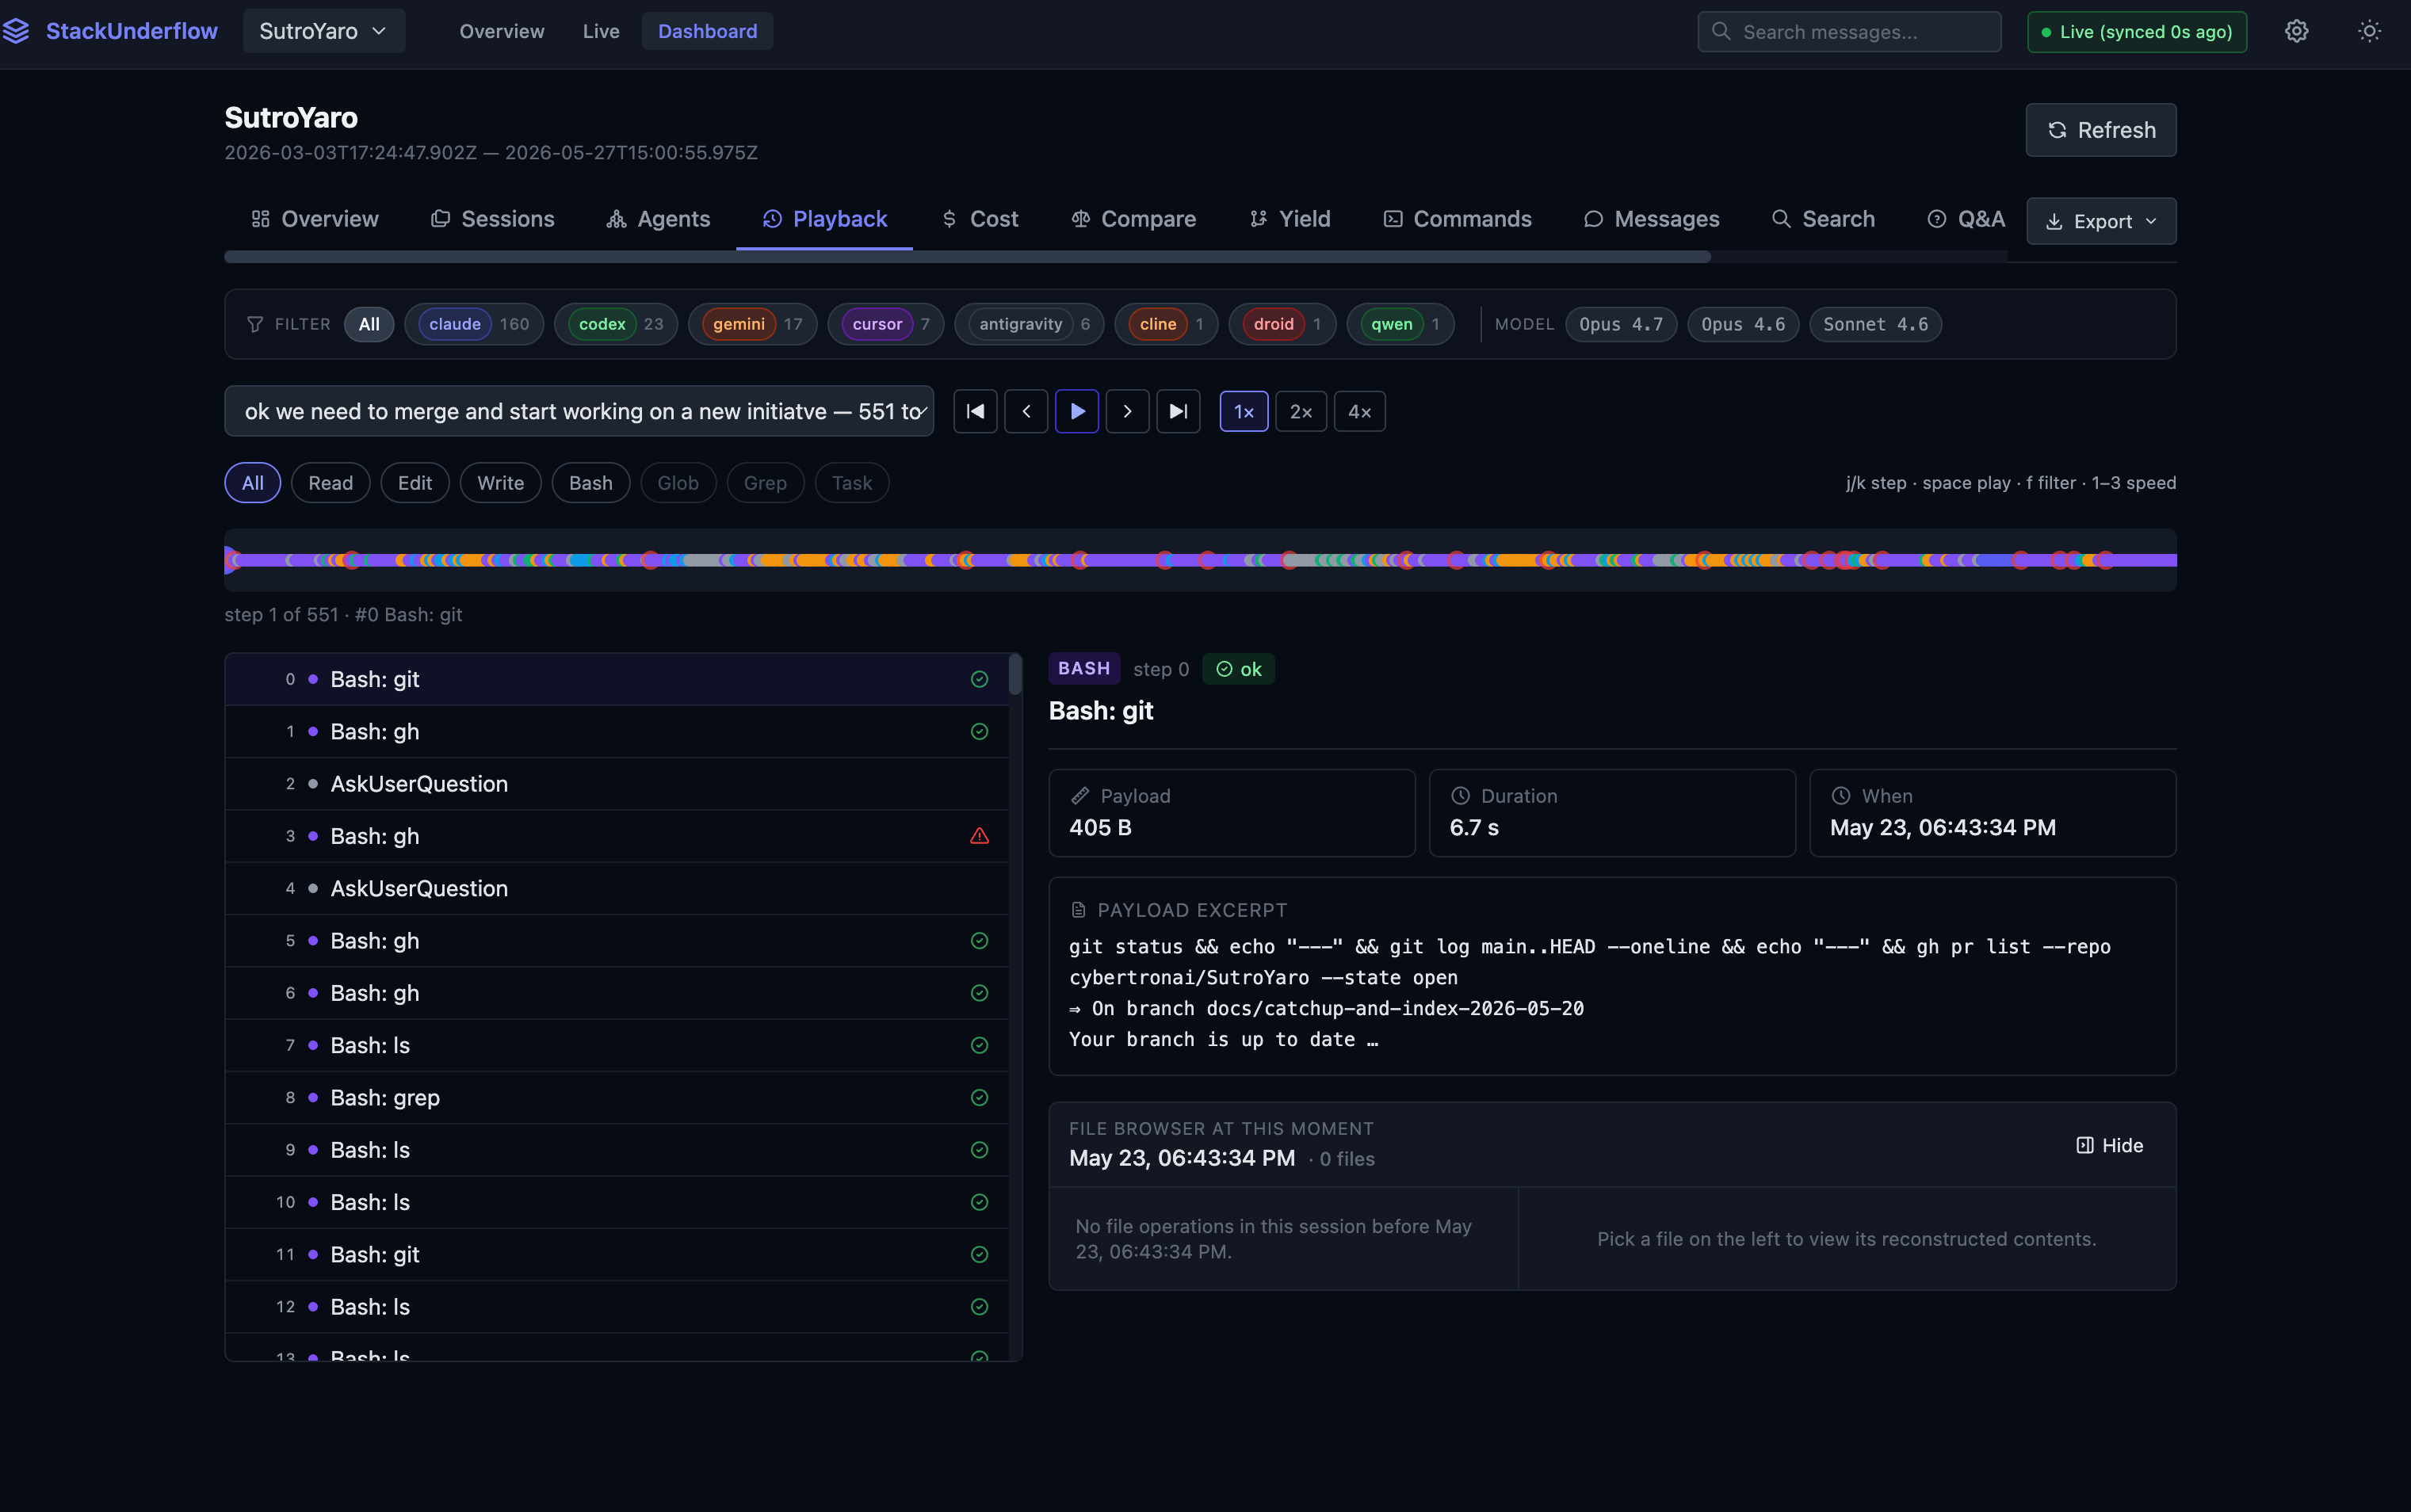
Time-travel playback. Scrub through a session’s tool calls in order, and at any point in the scrub, see the reconstructed contents of every file it touched. The playback engine replays Read, Write, Edit, MultiEdit, and NotebookEdit calls to rebuild a virtual filesystem at any millisecond in the timeline; where it never saw an initial Read, it marks the reconstruction partial rather than guessing. Below is a 551-step SutroYaro session played back, paused on a git call with its payload, duration, and the file tree as it stood at that instant.
Agent memory. This is the part I use most, and it’s why the tool exists. A CLI and a read-only MCP server let an active agent query its own history before it starts work. stackunderflow memory file <path> returns what past sessions changed in a file and how they failed. memory decisions "<topic>" surfaces prior decisions. memory worked "<action>" returns sessions where an action succeeded, with a confidence score so silence isn’t read as success. The output is token-budgeted and ranked by recency, cost, and relevance; an opt-in embeddings mode re-ranks by cosine similarity with a local sentence-transformers model. A chat sidebar runs the same queries against a local Ollama model, so you can ask “what is this session about?” and watch it call list_recent_sessions, get_project, and search_past_decisions to answer from your own history.
More than cost
The cost tab is the entry point. The same normalized event stream answers behavioral questions the dashboard wasn’t obviously built for.
Derailment. The Q&A extractor tags every question/answer pair resolved, looped, or abandoned. A session full of looped pairs is one where the agent kept re-asking itself the same thing and never closed it out. The optimize command rolls eight such detectors into one offline report: looped Q&A, files re-read five or more times in a session, cache thrash, unused MCP servers, a bloated CLAUDE.md, ghost agents, low read-to-edit ratios, and bash output hitting the truncation limit. On my own machine the cache-overhead detector flagged ~289M wasted tokens across 241 sessions, each one a run where cache-create tokens blew past half the input because related questions were spread across separate sessions instead of bundled. Every finding ships with a one-line fix.
Model regressions. When a new model ships, my error and retry rates climb for a few days while the harness and the model resettle. The week-over-week error-cost trend shows it before I’d catch it from inside any single session, and it shows the reverse too: a prompt or config change that quietly made runs cheaper.
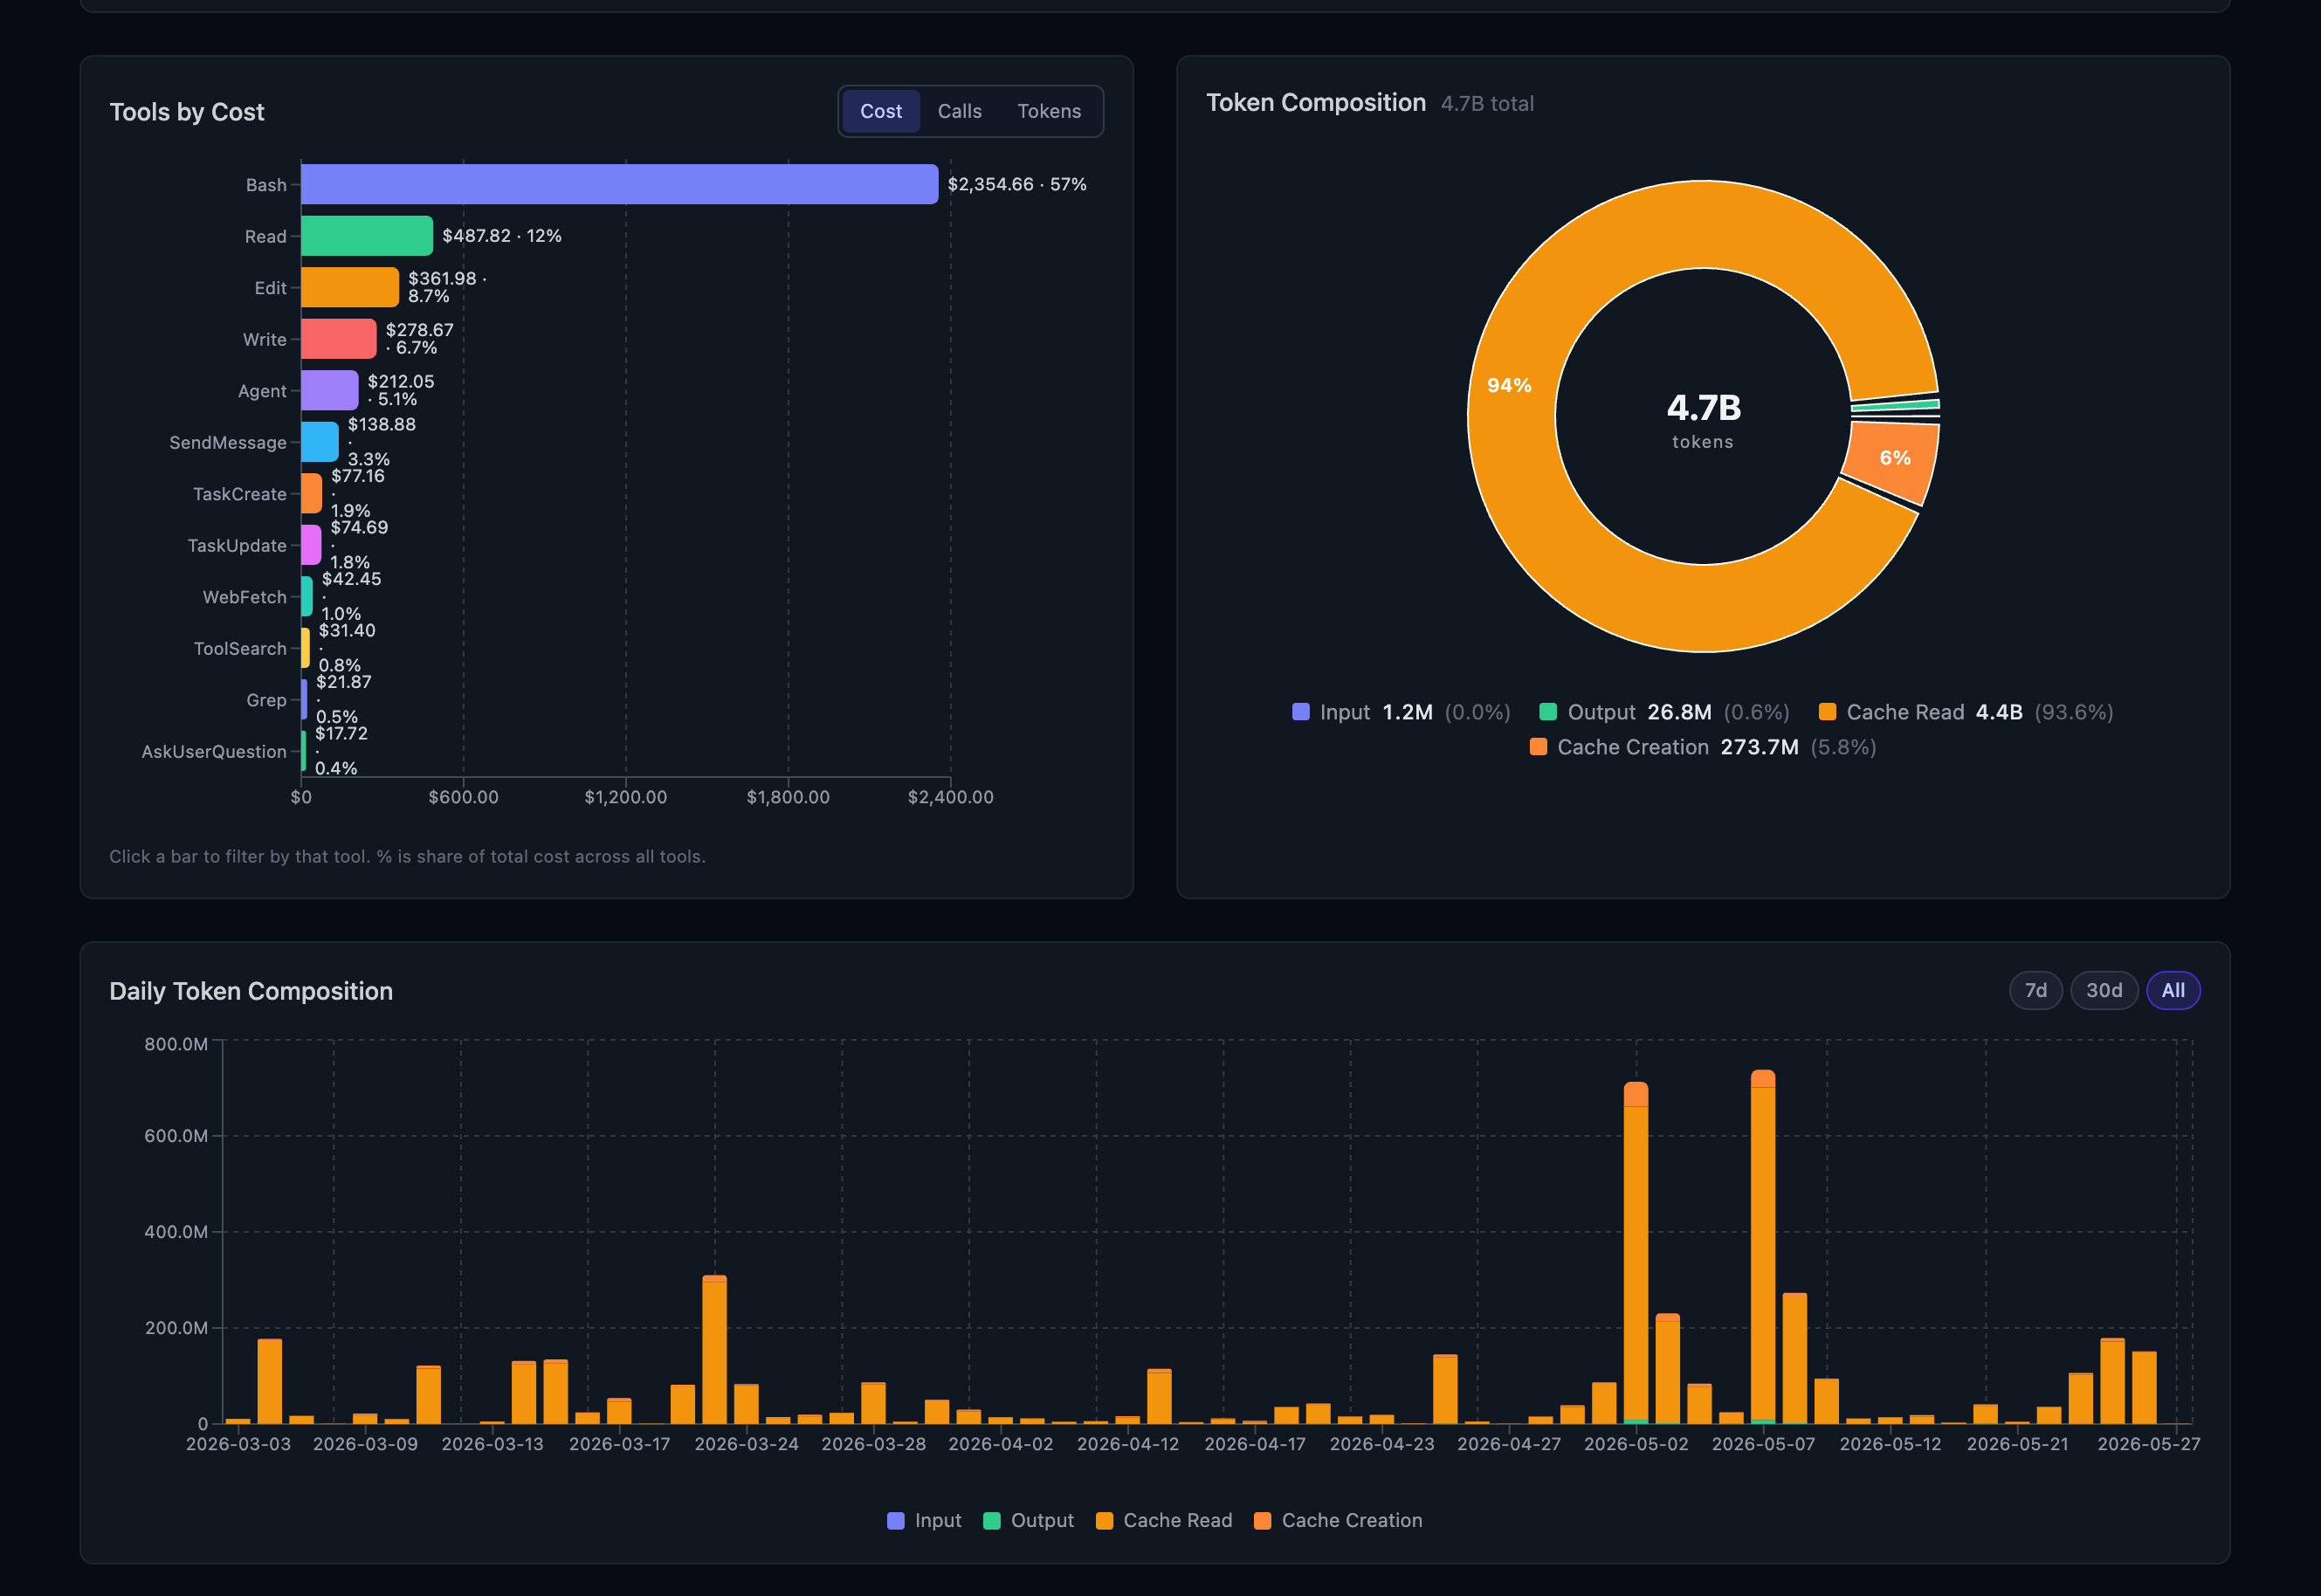
Bash patterns into toolkits. The tool-cost ranking shows what an agent actually spends its calls on. On that same repo, Bash is 57% of tool cost ($2,354), well ahead of Read at 12% and Edit at 8.7%, and the token mix is 93.6% cache reads out of 4.7B. When the same one-off bash snippet gets regenerated across a dozen sessions, that’s the signal to hand the agent a reusable skill instead of letting it rewrite the script each time. stackunderflow skills generate does part of this directly: it mines the store for recurring workflow patterns and writes them out as Claude Code SKILL.md files, so the next session reaches for a named tool.
Why a coding agent should care
Every agent session starts cold. Claude Code today knows nothing about what it debugged in the same repo last week, or the dependency pattern you settled on in a Cursor conversation the day before. Those sessions are all on disk and already indexed. The knowledge in them doesn’t flow back into the next session.
The memory commands close part of that gap, and they fire from a standing instruction instead of relying on me to remember. I keep the stackunderflow memory block in my global CLAUDE.md, so before a non-trivial edit the agent checks whether the answer is already recorded: what worked, what failed, which decisions were made and why. Any agent that can run a shell command or speak MCP reaches the store the same way, so Codex and Cursor get the same access as Claude Code.
Because every provider lands in one local store, the lookup crosses tools. A Claude Code session can ask what a Codex run did in the same directory last week, or what failed there last month, without either agent knowing the other exists. The MCP server gives each of them read access to that one store, so they draw on a shared history without sharing any live state.
The same backend exposes playback to an agent, not just to me in the dashboard. Before it touches a file that a past session broke, an agent can replay how that session mutated the file and read the outcome that followed.
The shape of it
Three layers tied together by a filesystem watcher and a watermarked refresh loop.
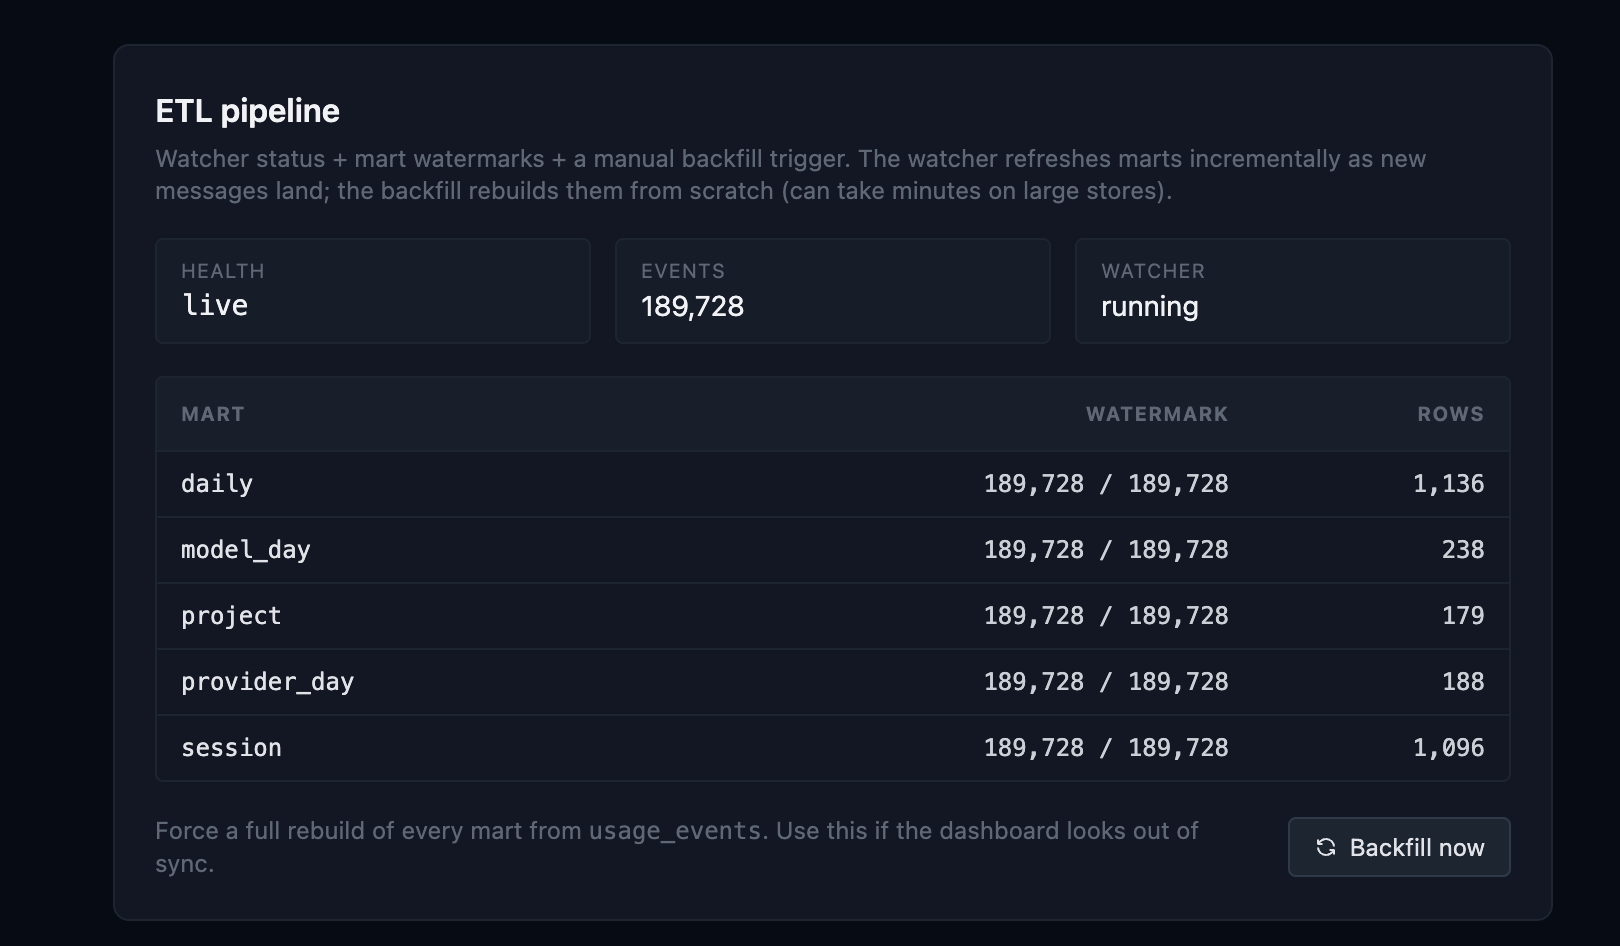
The marts are what keep it fast. The dashboard never queries the raw message table; it reads pre-aggregated reporting tables that the ETL builder maintains incrementally, each carrying a watermark of the last event it folded in. Five of them (daily, model-day, project, provider-day, session) track against the live event count, 189,728 on my machine right now, and a “Backfill now” button rebuilds them from scratch if they ever drift. On a 247K-message store the cold load drops from 2.5 seconds to under 50ms warm.
The backend is a FastAPI service with 23 route modules and a click-based CLI; the frontend is React, TypeScript, Tailwind, and Recharts. The store is plain SQLite in WAL mode at ~/.stackunderflow/store.db, with additive migrations. The fast test suite collects 2,781 tests. It’s at v0.9, heading toward a 1.0.
What’s real and what’s still an RFC
The analytics, playback, cost, yield, the CLI and MCP memory tools, and the local Ollama chat sidebar all ship, and I use them. The part I find most interesting isn’t built yet.
Right now the memory tools read raw messages and a few derived signals (Q&A pairs, tags, error detection). They don’t extract portable knowledge artifacts: a resolved decision, a fixed error, or a failed approach stored as a structured, searchable unit. There’s no push path, so an agent reads history but never writes a resolved decision back. And it’s single-machine, so Claude on this laptop can’t see what Codex resolved on another. The cross-agent knowledge RFC scopes that out (artifact extraction, a query/push API, encrypted cross-node sync), and most of it is still proposal, not code. I’d rather say that plainly than imply the knowledge layer already exists.
Where this leaves me
Coding agents cost money and leave a trail, and both are easy to lose track of. The Hinton and Schmidhuber catalogs were the same methodology a week apart, and comparing them on cost and on which sessions actually shipped meant walking the JSONLs by hand both times. The Schmidhuber writeup recovered those numbers once, manually, for one build. With the store running, that comparison is a query, and the next catalog build can be measured against the last one while it’s still going. The trail goes back to the agents too, so the next session doesn’t start from zero.
The repo is at github.com/0bserver07/StackUnderflow. It reads only the log paths its adapters point at, writes only to ~/.stackunderflow/, and the only things that ever leave the machine are a pricing snapshot and FX rates, both with offline fallbacks and neither carrying any of your data.
Links
- StackUnderflow: the repo, MIT
- Cross-agent knowledge RFC: the knowledge layer, still mostly proposal
- Multi-provider overview: the 17 adapters and their source paths